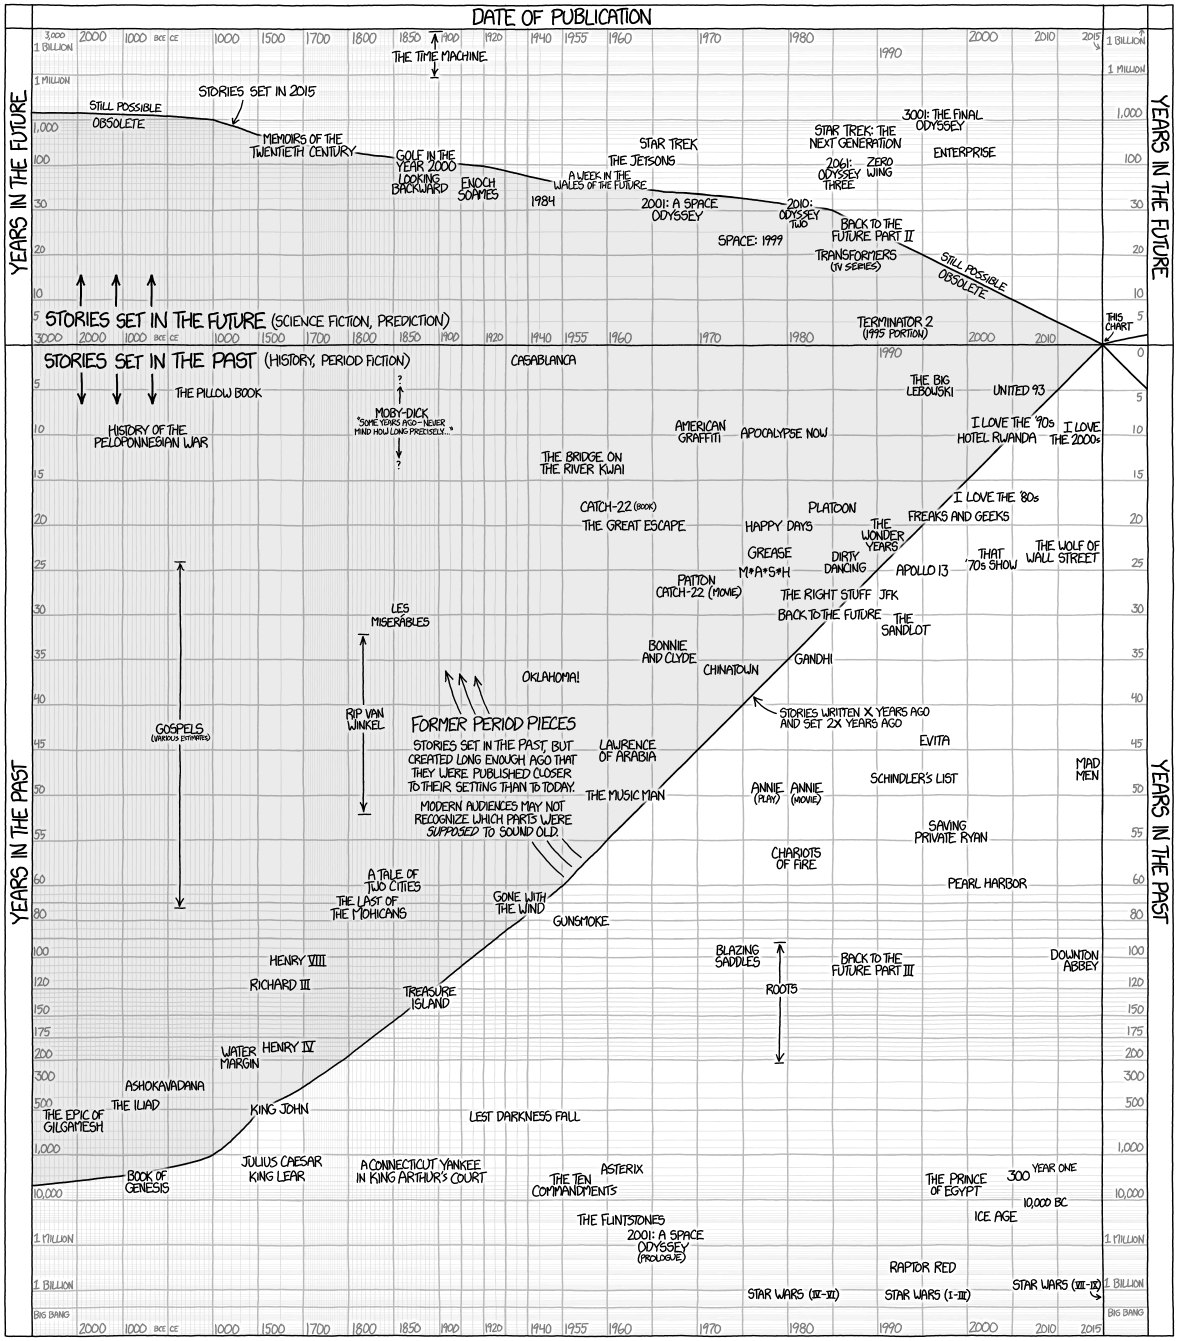
As a fan of xkcd and a data geek, Randall Munroe's creative and informative graphs are among my favorite comics. Stories of the Past and Future is one such.
The only problem with it is that it's static. We can't add other works to it. We can't come back to it years later and see how other works have faired.
So I decided to recreate it in R.
The original:
My version:

Data is stored in /data-raw/stories.csv, a UTF-8-encoded comma-separated value file. The first column contains the name of the work (inaccurately labeled "Movies"), the second column is the publication date, and the third and fourth colums are the range of dates in which the work is set.
For example, The Count of Monte Cristo was published in 1844, and the story spans the years from 1815 to 1839. Likewise, the main narrative of The Time Machine, published in 1895, spans roughly 802,701 AD to 30,000,000 AD. I have ignored the further excursions to billions of years into the future.
- Add some additional notations.
- Improve the scale transformations to provide smother transitions (probably add additional steps in the transform).
- Add bars to indicate the range of years across which a work takes place.
None.